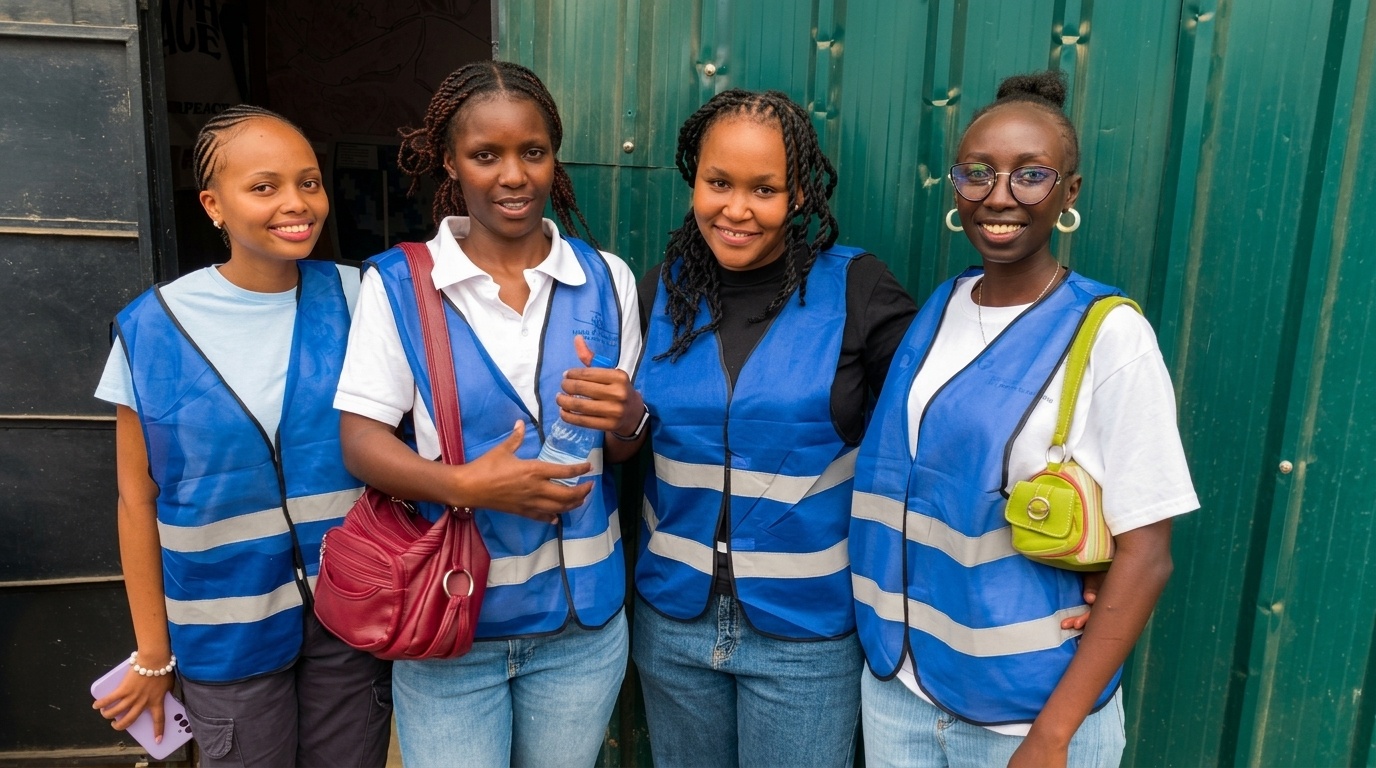
In June 2026, UN Mappers Kenya launched its first ever Youth Climate Mapping Externship, a seven-week virtual programme designed to put real geospatial tools in the hands of young Kenyans and point them at real climate problems in Nairobi. Nineteen university students answered the call.
A Programme Built by UN Mappers Kenya
The Youth Climate Mapping Externship 2026 is a UN Mappers Kenya initiative — born from the UN Maps chapter initiative and the belief that open geospatial data should be created by the communities it represents, not just for them. From the first session to the graduation ceremony, every element of this programme was designed and delivered under the UN Mappers Kenya banner.

The Journey
The externship ran from 29 June to 17 August 2026 across four progressive phases.
Phase 1 — Learn (Weeks 1 and 2)
Participants started from the ground up, climate issues facing Nairobi, GIS foundations, QGIS, and their first steps on OpenStreetMap. By the end of week two they had made real contributions to the global humanitarian map through the HOT Tasking Manager. For most of them it was the first time their work had ever left their laptop and gone somewhere that mattered.
Phase 2 — Map (Weeks 3 and 4)
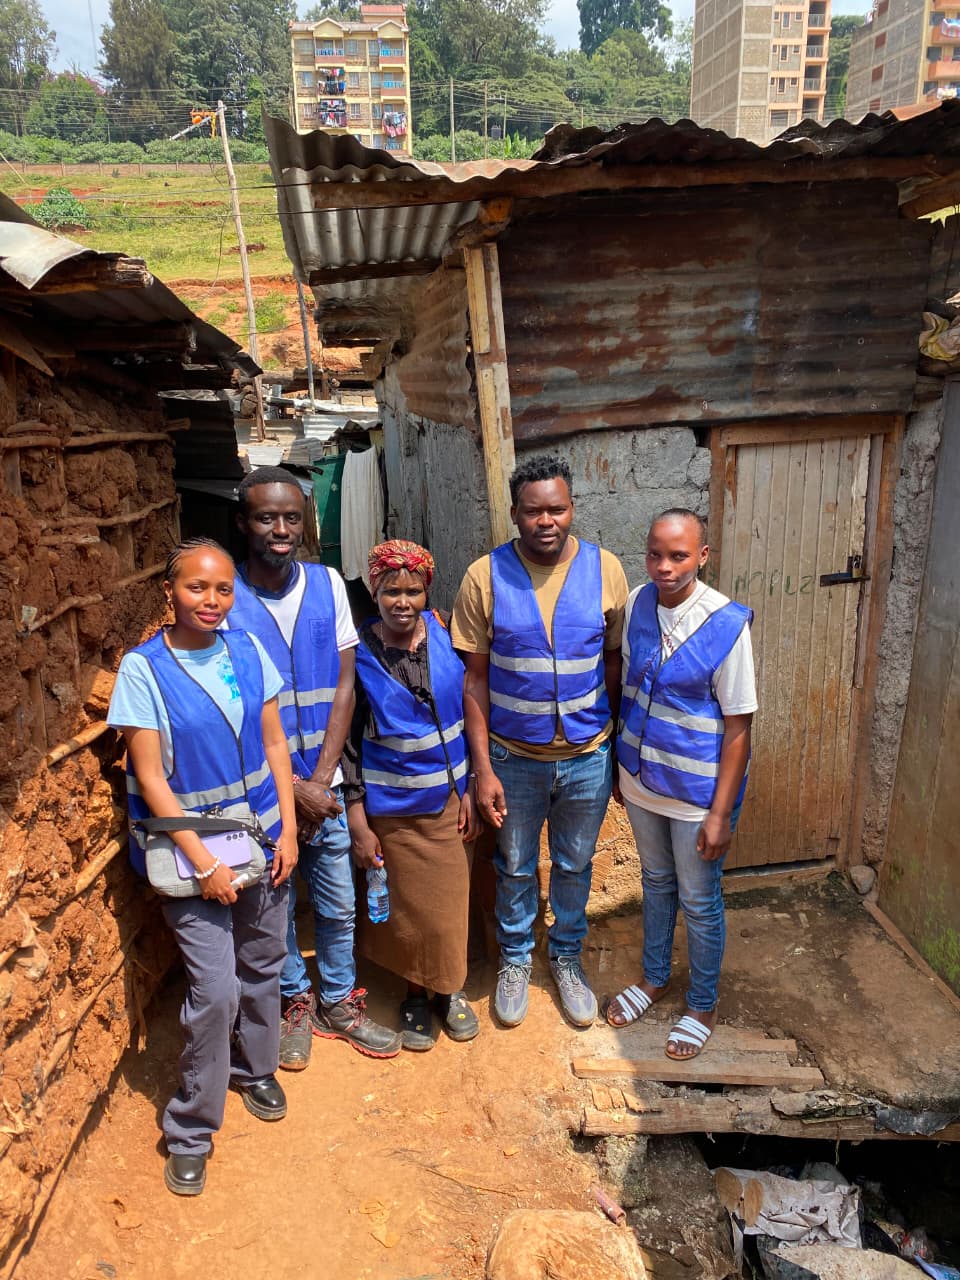
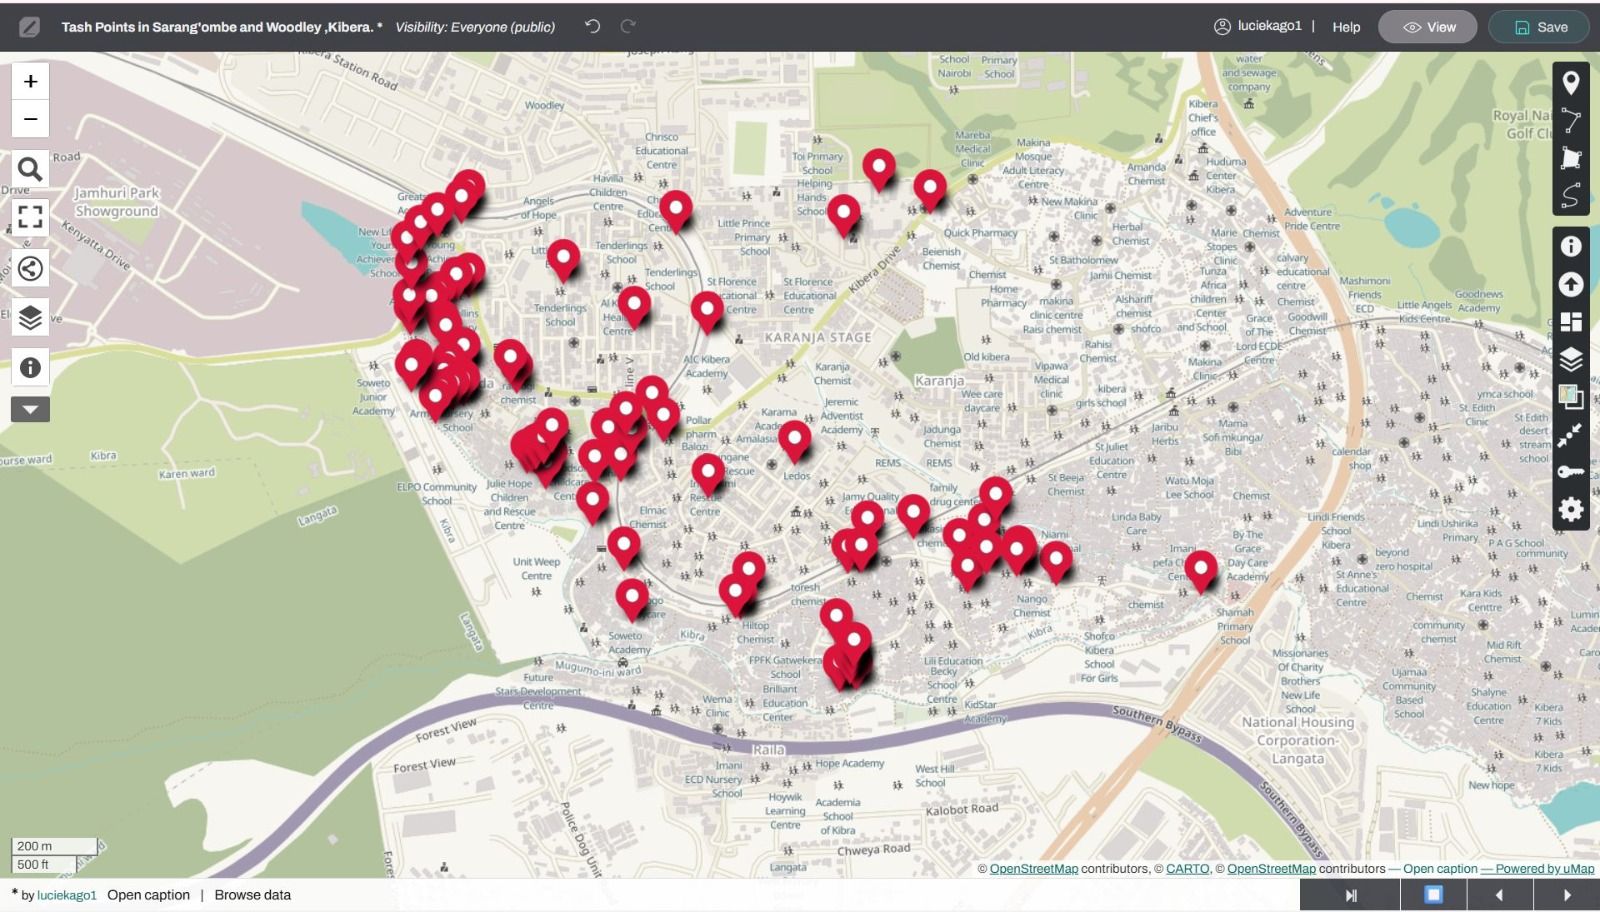
This is where things got real. Participants trained in KoboToolbox and Chat Map, then on a Saturday in July they went to Kibera , smartphones out, GPS on, walking through Woodley and Sarang'ombe to validate a waste mapping study that had not been revisited since 2020. Then in Week 4 they came back to their desks and turned that field data into flood risk models of Nairobi subcounties.
Phase 3 — Build (Weeks 5 and 6)
Data alone does not change anything. Maps that no one can read do not either. Week 5 was about cartographic design and learning to speak to the people who hold the pen on decisions. Week 6 was group project time, teams-built climate vulnerability maps and policy briefs for their assigned areas.
Phase 4 — Present (Week 7)
Teams submitted and presented their climate vulnerability maps to a panel including Nairobi County representatives. Then they graduated.
The Numbers
- 19 participants from universities across Kenya
- 70,000+ edits contributed to OpenStreetMap
- 15 sessions delivered across 7 weeks
- 270 hours of training and field work
- 8 expert trainers from Kenya, Argentina, the Philippines, and the global HOT network
- 82 trash points validated in Kibera
- 6 group climate vulnerability projects produced for Nairobi County

The People
This programme was only possible because extraordinary people showed up.
Lucy Kago — UN Maps Community Engagement Ambassador, Kenya
Lucy facilitated the Week 1 climate issues session, the OSM practical, Kobo Toolbox training session and led the Kibera field day on Saturday 18 July.
Arnalie Vicario — UN Mappers Community Engagement Specialist
Analie facilitated sessions on the UN Mappers programme and community engagement, bringing the global open mapping perspective to the cohort.
Laura Mugeha — UN Mappers
Laura and Arnalie facilitated Week 2
She took the cohort through the world of humanitarian mapping. She introduced participants to the UN Mappers context, how open mapping supports humanitarian response globally, and walked them through their first structured mapping campaign.
She connected our Nairobi classroom to the bigger picture of why this work matters beyond the map.
Silvina Maritano — UN Mappers Ambassador, Argentina
Silvina facilitated the Week 3 Chat Map session, joining virtually from Buenos Aires.
Ruth Kago — Learning Designer
Ruth designed the programme curriculum, shaping the structure and learning experience from the ground up.
Raquel Dezidério Souto — CEO, IVIDES DATA
Raquel Dezidério, made this entire programme possible. She believed in us before we had a single participant, sponsored the programme from start to finish, and stayed with us every step of the way. This cohort exists because of her. We called and she answered.
Ivan Kipruto — Geospatial Developer
Ivan facilitated the Week 1 QGIS introduction and geospatial foundations session.
Mr Martin Wainaina Chege — Cartographer, DeKUT
Martin facilitated the Week 4 GIS analysis and flood risk modelling sessions.
Catherine Njore — Lead Cartographer, GeoMind Solutions
Ms.Catherine facilitated the Week 5 cartographic design and map storytelling sessions. Author of Mappy Maria, Kaunti za Kenya, and My Stern Mom, she left the cohort with one line that stuck: "The tools mean nothing if the map does not speak to the person holding it."
The Kibera Field Team — Week 3
A special recognition goes here. Nicera Wanjiku and the Kibera Community mappers team opened Kibera's doors to our participants. They did not just provide access ,they walked alongside the cohort through Woodley and Sarang'ombe, guiding the ground-truthing exercise with the authority of people who actually live the data they helped collect. That day would not have happened without them.
What Was Built
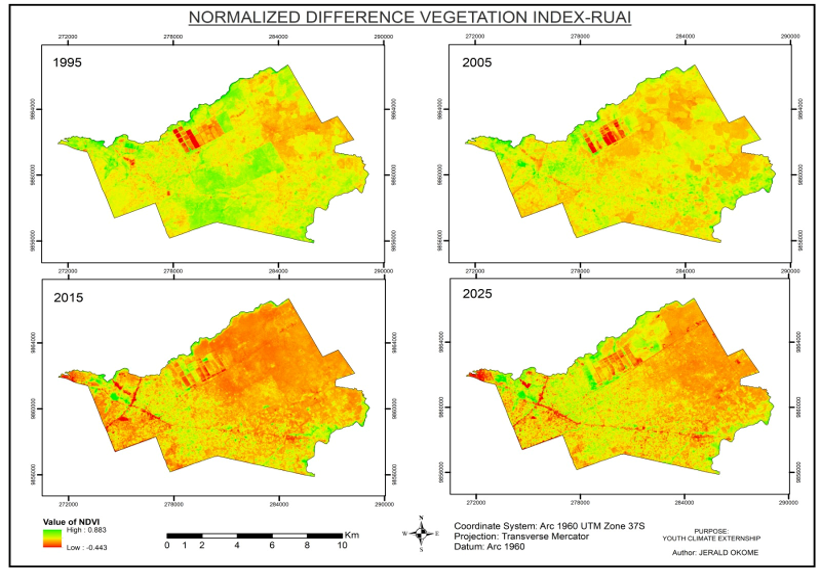
Group 1 - Multi-Temporal Analysis of Vegetation Change in Ruai, Nairobi
Thirty years of NDVI data. One clear finding, Ruai is losing its green, and residential and industrial expansion is driving it.
Story map here: Multi-Temporal Analysis of Vegetation Change in Ruai, Nairobi
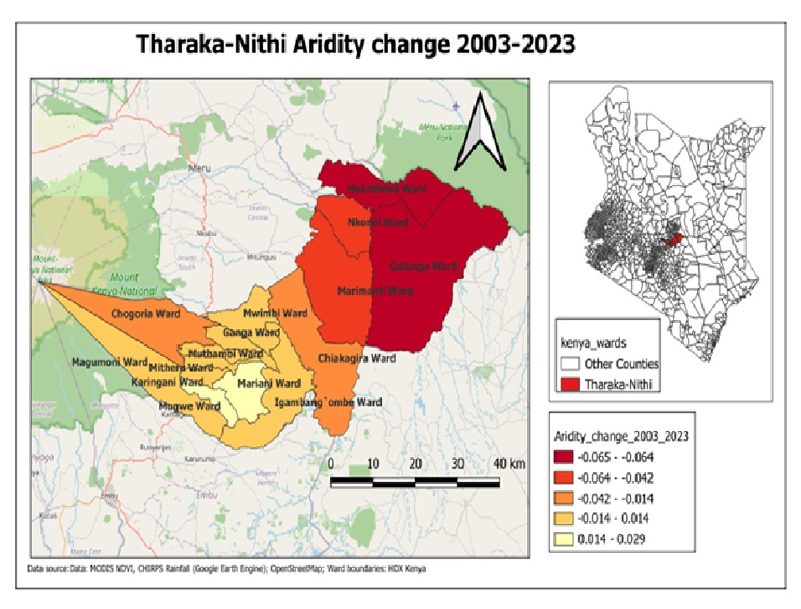
Group 2 - Tharaka Nithi Aridity Change 2003 to 2023
Six wards. Twenty years. A 39% fall in sorghum production. This group mapped a drought story that agriculture statistics alone could not tell.
Story map here: Tharaka Nithi Aridity Change 2003 to 2023
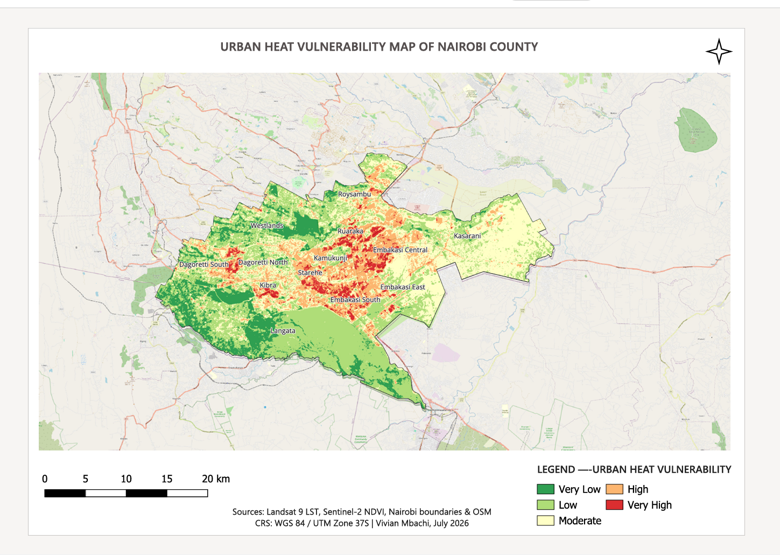
Group 3 - Analysis of Urban Heat Islands to Support Mitigation Measures
Nairobi is getting hotter and some parts of it are heating faster than others. This project mapped where, by how much, and what planting trees can actually do about it.
Story map here: Analysis of Urban Heat Islands to Support Mitigation Measures
Group 4 - Mapping Greenspace Loss to Urban Development 2017 to 2026
A decade of watching green disappear under concrete and a look at where interventions are actually working.
Story map here: Mapping Greenspace Loss to Urban Development 2017 to 2026

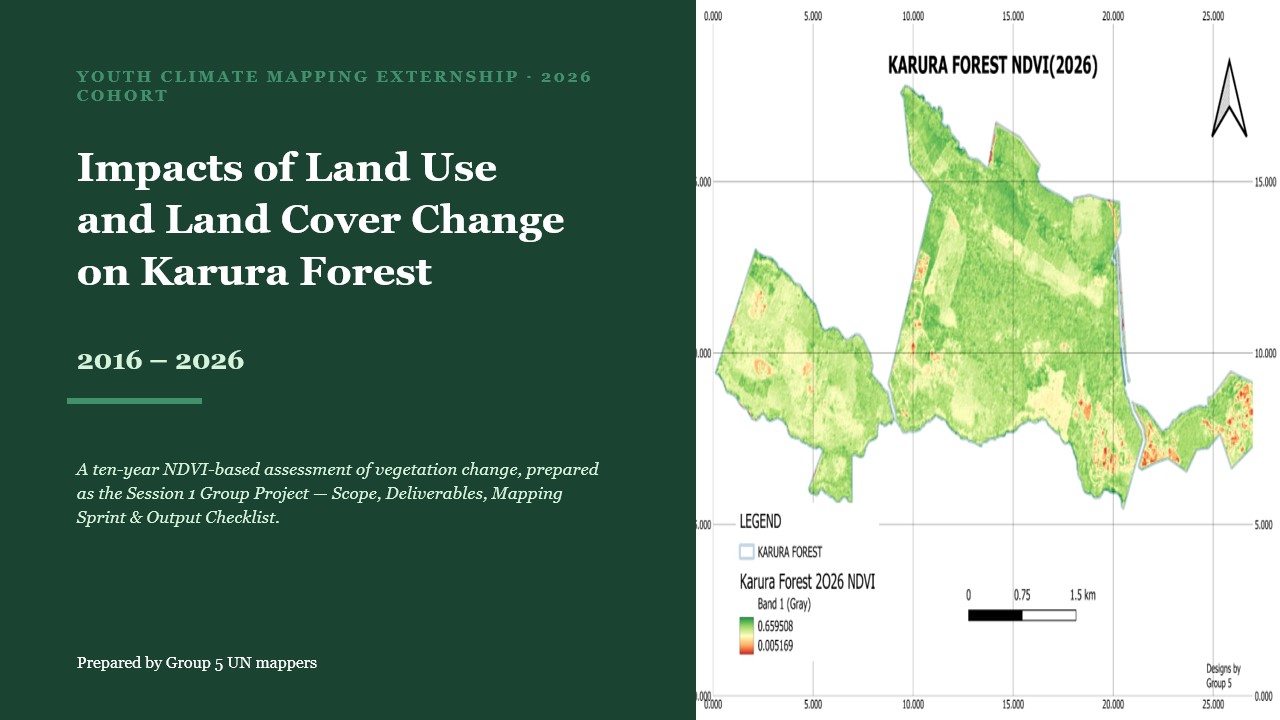
Group 5 - Impact of Land Use and Land Cover Change for Karura Forest 2016 to 2026
One of Nairobi's most important lungs, mapped over ten years. The hotspots of degradation are now visible.
Presentation here: Karura Forest LULC 2016-2026 (1).pptx
Group 6 - Suitability Analysis for Kibera Trash Points
Where should new waste collection points go in Kibera? This group built a GIS model to answer that question — spatially grounded, community-centred, and ready for use.
Our Partners
None of this was done alone.
IVIDES DATA-Programme Sponsor.
Believed in this work before it had a single participant and funded it throughout.
GeoMind Solutions —Technical partner
Contributed Ivan Kipruto in Week 1 and Catherine Njore in Week 5.
Geospatial Developers, Dedan Kimathi University of Technology — Technical Partner.
Community mappers Kibera — Community Partner.
The reason the Kibera field day was possible and the reason it meant something.
UN Maps
The programme this entire externship is built within. The platform, the network, and the mission.

Nineteen students. Seven weeks. Seventy thousand edits on the global map. Six projects for Nairobi County. One field day in Kibera that nobody who was there will forget.
Nairobi Cohort 1. Done. 🗺️